CFD

Cut Plot (Velocity)
It is possible to extract necessary data
such as agitation speed and pressure
of the analysis target at a desired time
and represent it as an image.
such as agitation speed and pressure
of the analysis target at a desired time
and represent it as an image.
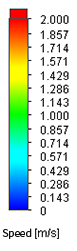
Range : 0~2 m/s (0.003s interval)
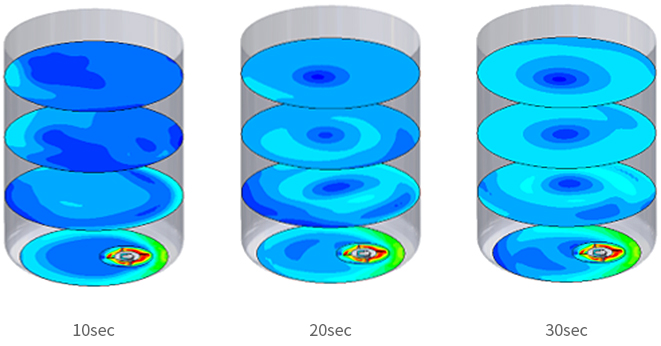
Surface Plots (Velocity)
You can visually confirm the fluid agitation status
Range : 0~2 m/s (0.003s interval)

Flow Trajectories (Velocity Vector)
The fluid flow of the analysis target can be
visually represented as a video at a desired time.
visually represented as a video at a desired time.
Plot range : 0~2 m/s

10sec
20sec
30sec
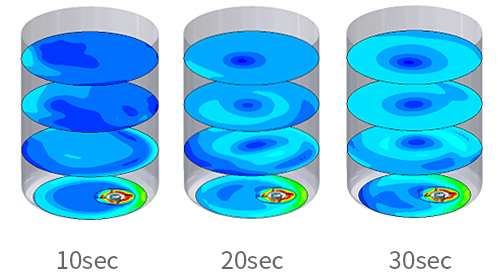
Cut Plot (Velocity)
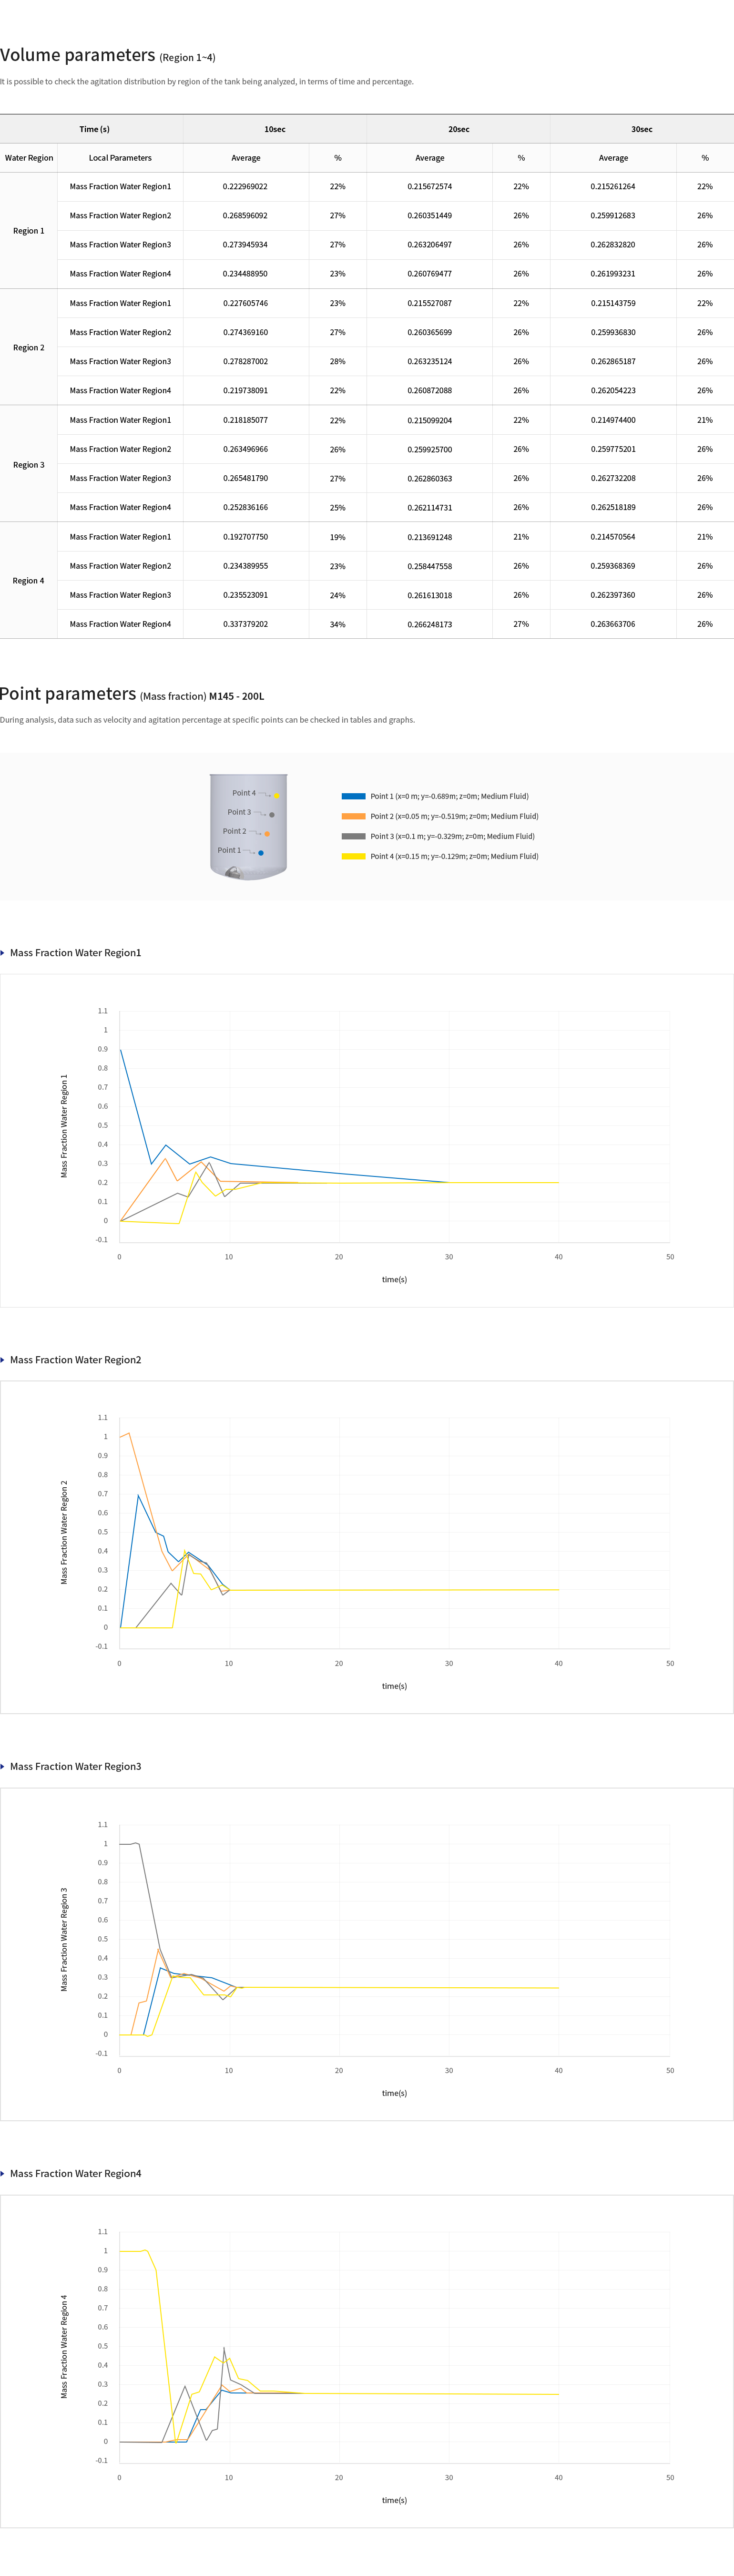
The agitation of the fluid can be divided into
regions, digitized, and represented as a video
regions, digitized, and represented as a video
Range : 0~2 m/s
M145 -200L

0sec
10sec
20sec
30sec